

Table of contents
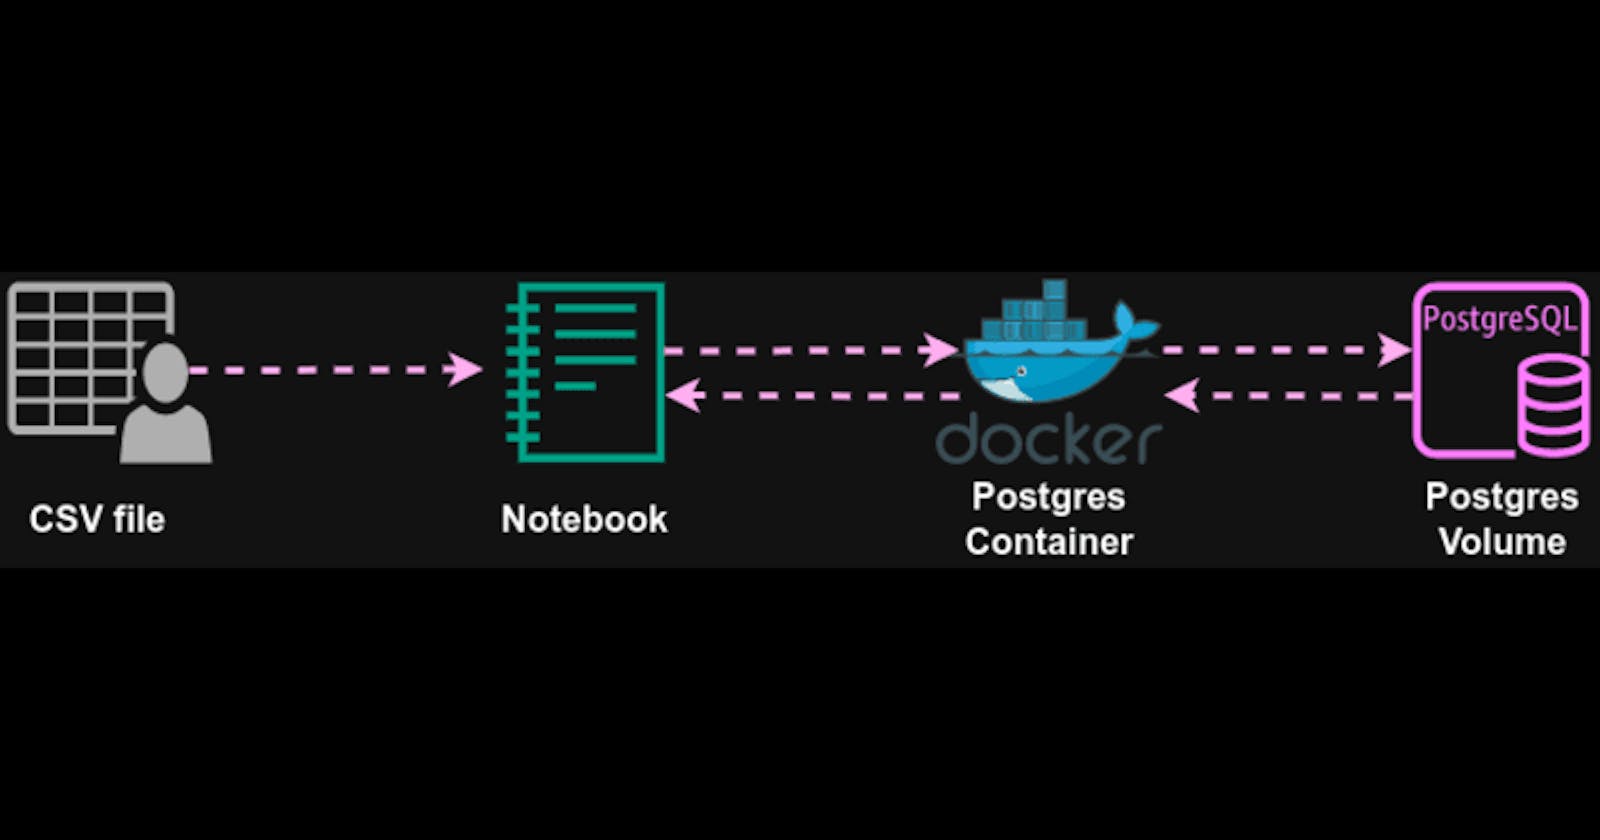
We'll ingest the NYC taxi zone lookup data into a postgres database through a postgres container and visualize it using python, pandas, sqlalchemy and matplotlib. This setup allows us to use the best analytical capabilities of both SQL and Pandas. The GitHub repository of this project can be found at the below URL: -
(https://github.com/Aditya-Tiwari-07/python_postgres)
Local Setup
Access an Ubuntu OS, with python 3 installed, through any of the following ways:
Use a cloud development environment like GitHub Codespaces, Gitpod or AWS Cloud9.
Create an Ubuntu virtual machine using VMware or Virtual Box.
Install Ubuntu OS on you local machine.
Launch a terminal and change into the home directory.
Install Docker.
 # Add Docker's official GPG key:
 sudo apt-get update
 sudo apt-get install ca-certificates curl gnupg
 sudo install -m 0755 -d /etc/apt/keyrings
 curl -fsSL https://download.docker.com/linux/ubuntu/gpg | sudo gpg --dearmor -o /etc/apt/keyrings/docker.gpg
 sudo chmod a+r /etc/apt/keyrings/docker.gpg

 # Add the repository to Apt sources:
 echo \
   "deb [arch=$(dpkg --print-architecture) signed-by=/etc/apt/keyrings/docker.gpg] https://download.docker.com/linux/ubuntu \
   $(. /etc/os-release && echo "$VERSION_CODENAME") stable" | \
   sudo tee /etc/apt/sources.list.d/docker.list > /dev/null
 sudo apt-get update

 # Install docker and docker compose.
 sudo apt-get install docker-ce docker-ce-cli containerd.io docker-buildx-plugin docker-compose-plugin
Check if docker is installed by executing the following commands. You should get the latest version of docker as the output.
docker -vCreate directory for project and change into it.
 mkdir python_postgres
 cd python_postgres
Inside project directory create directory for postgres db (TLU stands for 'taxi look up'). Add this directory to the .gitignore file.
mkdir TLU_data_postgresExport environment variables for the user, password and database name of the postgres database.
 export USER = your_username
 export PSWD = your_password
 export DB = database_name
Run the below command in the project directory to pull and run the postgres:13 docker image with the necessary run references. The postgres container is run in detached mode, so that you get the terminal back.
 docker run -d \
     -e POSTGRES_USER= $USER \
     -e POSTGRES_PASSWORD= $PSWD \
     -e POSTGRES_DB= $DB \
     -v $(pwd)/TLU_data_postgres:/var/lib/postgresql/data \
     -p 5432:5432 \
     --name pg-database \
     postgres:13
Download csv file in the project directory using wget.
wget https://d37ci6vzurychx.cloudfront.net/misc/taxi+_zone_lookup.csvInstall pandas, sqlalchemy, psycopg2 and matplotlib if not already installed.
pip install pandas
pip install sqlalchemy
pip install psycopg2
pip install matplotlib
Create .ipynb file in the project directory in vscode (install jupyter notebook extensions) or launch a jupyter server with the below command and create a notebook in the project directory.
jupyter notebook
Data Ingestion and Analysis using Python and Postgres
In the notebook, import the necessary libraries in the first cell.
 import pandas as pd
 from time import time
 from sqlalchemy import create_engine
 import matplotlib.pyplot as plt
 import os
Create sqlalchemy engine
 engine = create_engine("postgresql://{USER}:{PSWD}@localhost:5432/{DB}".format(**os.environ))
 engine.connect()
Read CSV file into a pandas dataframe and check the first 5 rows.
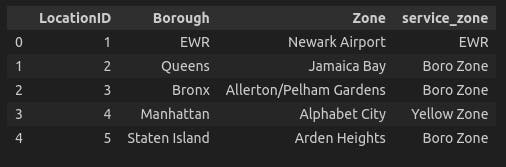
 df_zones = pd.read_csv('taxi+_zone_lookup.csv')
 df_zones['service_zone'].fillna('None', inplace=True)
 df_zones.head()
Output:
Ingest the df into the postgres db using pandas and the sqlalchemy engine.
df_zones.to_sql(name='taxi_zone_data', con=engine, if_exists='replace')Query the pg db and convert query result into a dataframe using sqlalchemy engine and pandas.
 query = "SELECT service_zone, COUNT('Zone') AS zone_count FROM zones GROUP BY service_zone ORDER BY zone_count"
 df_query = pd.read_sql(query, con=engine)
 df_query
Output:

Use matplotlib for visualizing the dataframe.
plt.bar(df_query['service_zone'], df_query['zone_count'], color='blue')Output:

We can clearly see that most taxi lookup zones are present either in the Boro or the Yellow service zones. Similarly many other insightful analyses and visualizations can be made using this setup of python, pandas, sqlalchemy, postgres and matplotlib.